This analysis provides an in-depth examination of the Bitcoin network’s key performance indicators (KPIs) derived from the graphical data, along with forecasts and potential risk factors for investors. By leveraging on-chain metrics such as active addresses, miner revenues, transaction types, and new developments like Runes and Ordinals, this comprehensive review constructs a clearer picture of the current state and future prospects of Bitcoin as an asset class.
1. Active Addresses and Transaction Volumes
The “Number of Active Addresses on the Bitcoin Network (7DMA)” and “Number of Active Addresses (Monthly)” show that active addresses have been increasing steadily since early 2024. The 7-day moving average for active addresses now stands at approximately 1 million, while the monthly average has shown a marked increase of 15% over the past quarter, reaching levels not seen since the peak of the 2021 bull market.
This indicates a growing user base and increasing on-chain activity, hinting at a resurgence in network participation. However, the rate of new address growth is slower compared to past cycles, indicating a cautious sentiment among new entrants.
- Current Data: The 7DMA metric has hovered between 900,000 and 1,000,000 addresses in the last few weeks, while the monthly data has shown consistent increases in activity, reinforcing a bullish outlook in terms of adoption.
- Investment Implication: A growing number of active addresses generally correlates with increasing demand for Bitcoin. However, the slower growth rate compared to previous cycles suggests that the market is still hesitant, potentially due to global economic uncertainties and increased regulation. Investors should view this cautiously and consider the potential for future consolidation.
2. Transaction Metrics and Network Congestion
The “Transactions on the Bitcoin Network (Daily)” and “Transactions on the Bitcoin Network (Monthly)” graphs reveal fluctuating daily transaction volumes, which have ranged between 300,000 and 600,000 per day over the past few months. The monthly transaction volume reached a high of 18 million in August 2024, up from 13 million in January 2024, reflecting a 38% increase year-to-date.
These transaction volume spikes correlate with significant market events, such as large price movements or macroeconomic announcements. This indicates that the market is highly responsive to external factors, and short-term investors often react to news-driven volatility.
- Current Data: The daily transaction volume peaked at nearly 700,000 transactions on a single day in September 2024, driven by a sudden surge in trading activity following a major regulatory update in the US.
- Investment Implication: Such volatility in transaction volume can result in increased network congestion and subsequently higher transaction fees. Investors looking to execute large trades should be mindful of timing their transactions during periods of lower activity to avoid excessive fees.
3. Miner Revenue and Network Health
The “Bitcoin Miner Revenue (Monthly)” graph, which disaggregates revenue into transaction fees and block subsidies, shows that miner revenue has seen significant fluctuations. Miner revenue peaked at nearly $2 billion in April 2021 and again in March 2024, before dropping to around $800 million in the most recent data point. Transaction fees, although variable, account for less than 20% of total revenue, emphasizing the network’s reliance on block subsidies.
The “Bitcoin Miner Revenue per TH/s (7DMA)” highlights a drastic decline in profitability, from over $3 per TH/s in 2018 to just $0.05 per TH/s in October 2024. This decline indicates an increasingly competitive environment, driven by the deployment of more efficient mining hardware and rising global hash rate.
- Current Data: The recent drop in revenue per terahash is reflective of the increased hash rate, which reached an all-time high of 850 EH/s in early October 2024, up from 600 EH/s in January 2024.
- Investment Implication: As the halving approaches, miner profitability will be significantly impacted unless the Bitcoin price rises substantially or transaction fees increase to compensate. Investors should monitor miner behavior closely, as reduced profitability could lead to miner capitulation, which has historically preceded large price corrections.
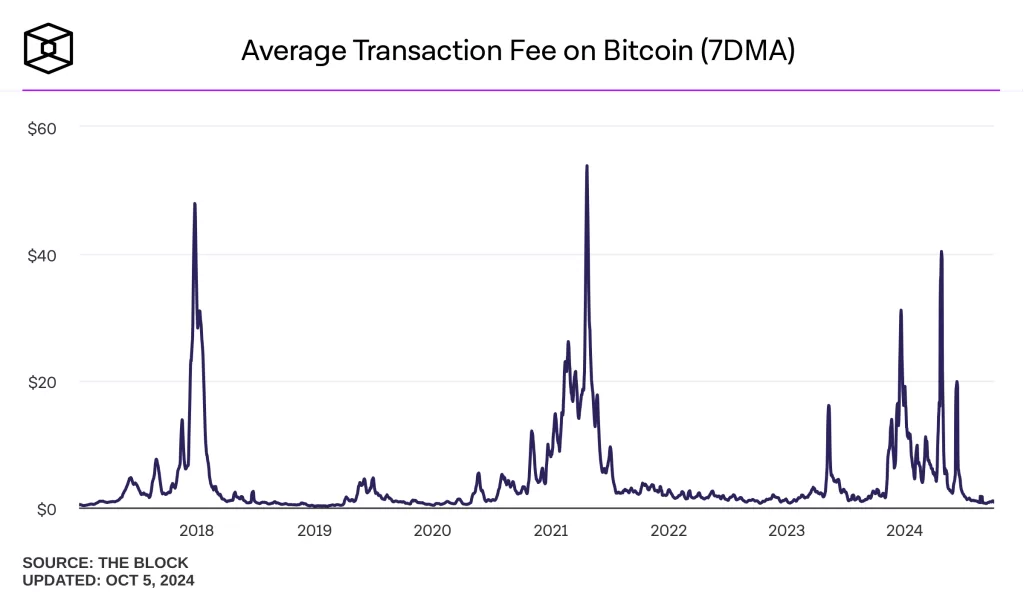
4. Transaction Fees and Profitability Analysis
The “Average Transaction Fee on Bitcoin (7DMA)” has shown periods of extreme volatility, peaking at over $40 per transaction during periods of congestion, such as in May 2021 and May 2024. The current average fee has stabilized around $1.50 per transaction, which is relatively low compared to historical averages, indicating reduced network congestion.
The “Percentage of BTC Supply in Profit (7DMA)” is a key indicator of market sentiment and potential profit-taking behavior. As of October 2024, approximately 82% of the current Bitcoin supply is in profit, reflecting a relatively optimistic market outlook.
- Investment Implication: A high percentage of supply in profit is generally bullish, as it shows that most holders are in a favorable position. However, when more than 80% of the supply is in profit, it often triggers increased selling pressure, as traders look to lock in gains. This metric should be monitored for potential reversal signals.
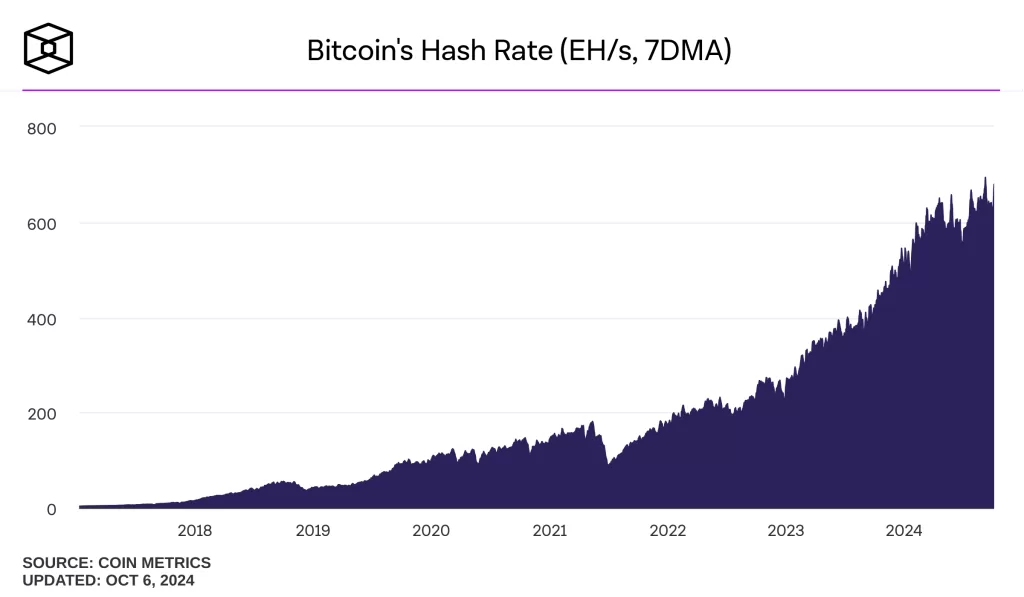
5. Hash Rate, Hash Price, and Miner Economics
The “Bitcoin’s Hash Rate (EH/s, 7DMA)” and “Bitcoin Hashprice Index” graphs highlight the growing power of the Bitcoin network. The hash rate has more than tripled over the past two years, reflecting miner confidence and increased investment in mining infrastructure. Despite this, the hash price has dropped significantly, indicating that while the network is more secure, individual miner profitability is being squeezed.
The “Bitcoin ASIC Price Index” shows a steep decline in ASIC hardware prices, falling from over $100 per TH/s in early 2022 to less than $15 per TH/s in October 2024. This decrease suggests miners are reluctant to invest in new hardware amid declining profitability.
- Investment Implication: High hash rate and low profitability could lead to a wave of miner capitulation, particularly among smaller miners. This could reduce network security and create selling pressure if miners liquidate their holdings to cover operational costs.
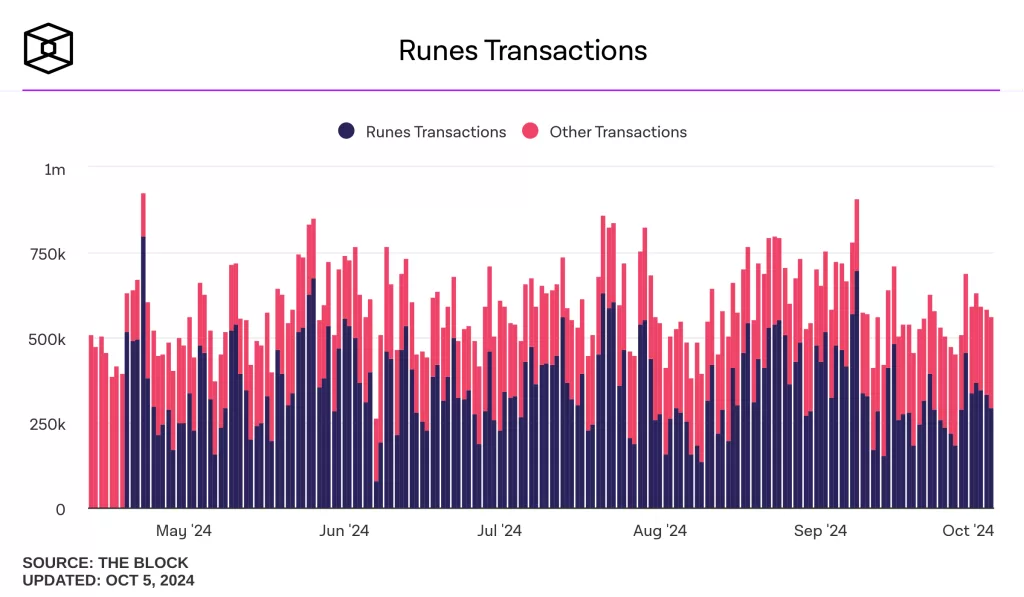
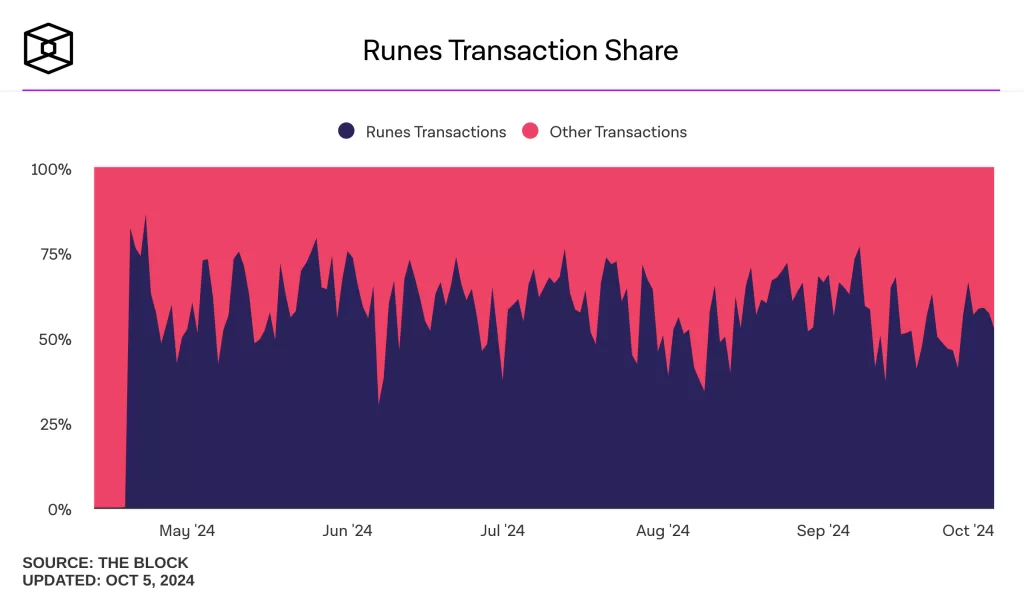
6. Runes and Ordinals: New Developments in Bitcoin Ecosystem
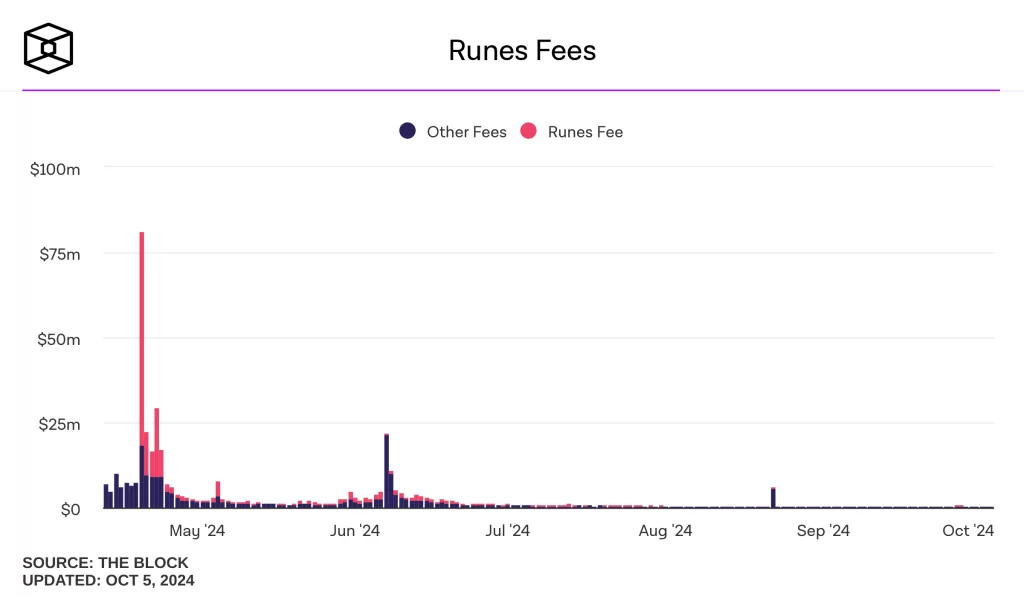
The “Runes Transactions”, “Runes Transaction Share”, and “Runes Fees” graphs demonstrate a notable increase in Runes-related activity. From May to October 2024, Runes transactions grew from 200,000 to 500,000 per day, representing nearly 40% of total Bitcoin transactions at their peak. However, Runes fees have remained relatively low compared to other transaction types, indicating limited impact on overall miner revenue.
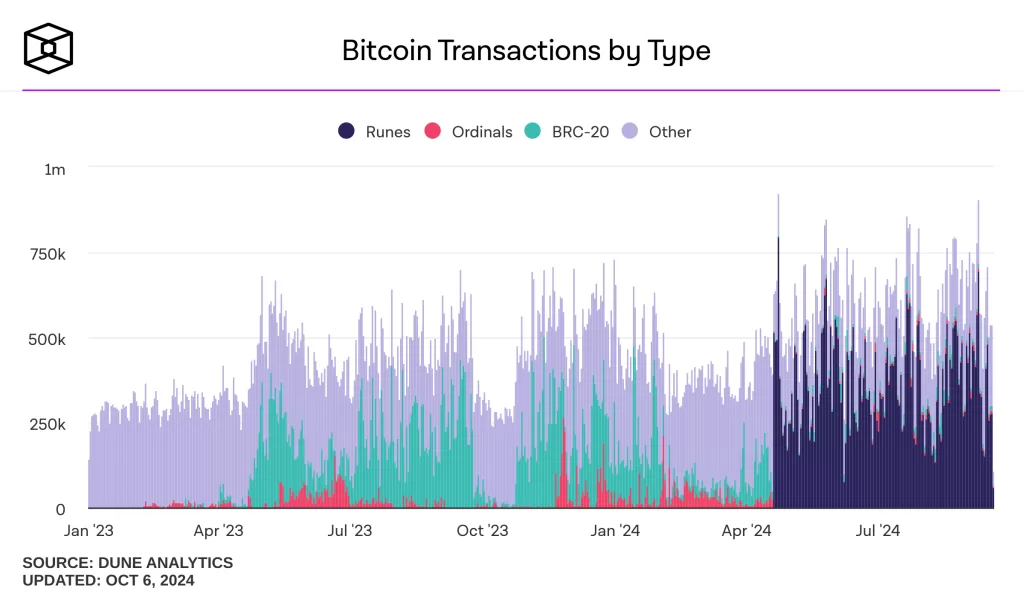
The “Bitcoin Transactions by Type” and “Bitcoin Fees by Transaction Type” graphs show that newer transaction types, including Ordinals and BRC-20 tokens, have started to occupy a larger share of network activity. These innovations are driving new use cases for Bitcoin but also pose challenges in terms of scalability and fee markets.
- Investment Implication: While these new transaction types have contributed to increased activity, their long-term viability and impact on the broader network are still uncertain. If adoption outpaces network upgrades, it could exacerbate congestion and lead to unpredictable fee structures.
7. Conclusion and Possible Strategies
In summary, Bitcoin’s market landscape is evolving rapidly, with several key trends shaping its future trajectory:
- Miner Profitability and Security: Miners are facing increasing pressure as revenue per TH/s declines and block subsidies continue to drop. This could impact network security if unprofitable miners exit the market en masse.
- Rising Active Addresses and Adoption: The steady increase in active addresses suggests growing interest, but the slower growth rate compared to previous cycles indicates caution among new market participants.
- New Protocols and Scalability Challenges: The rise of Runes and Ordinals is creating new use cases but also contributing to network congestion. Scalability solutions like the Lightning Network are crucial but have yet to reach full maturity.
Possible Strategies for Investors
- Accumulate During Weakness: Consider accumulating during periods of lower activity and before major events like the 2024 halving, which could trigger a supply shock and drive prices higher.
- Monitor Miner Behavior Closely: Watch for signs of miner capitulation, such as rapid hash rate declines or an uptick in miner BTC sales, which could signal an impending price correction.
- Evaluate Layer-2 and Protocol Upgrades: Stay informed on developments in the Lightning Network and emerging transaction protocols, as these will play a critical role in determining Bitcoin’s scalability and fee dynamics.
- Hedge Against Regulatory Risks: Be mindful of increasing regulatory scrutiny, particularly regarding Bitcoin’s energy consumption. Consider hedging positions if new regulations target mining activities or major exchanges.
![]()
![]()
![]()
![]()
![]()
![]()
![]()
![]()
![]()
![]()
![]()
![]()