Historical analogies are one of the most powerful cognitive shortcuts in investing. They help structure uncertainty and frame risk. But they can also mislead when used superficially.
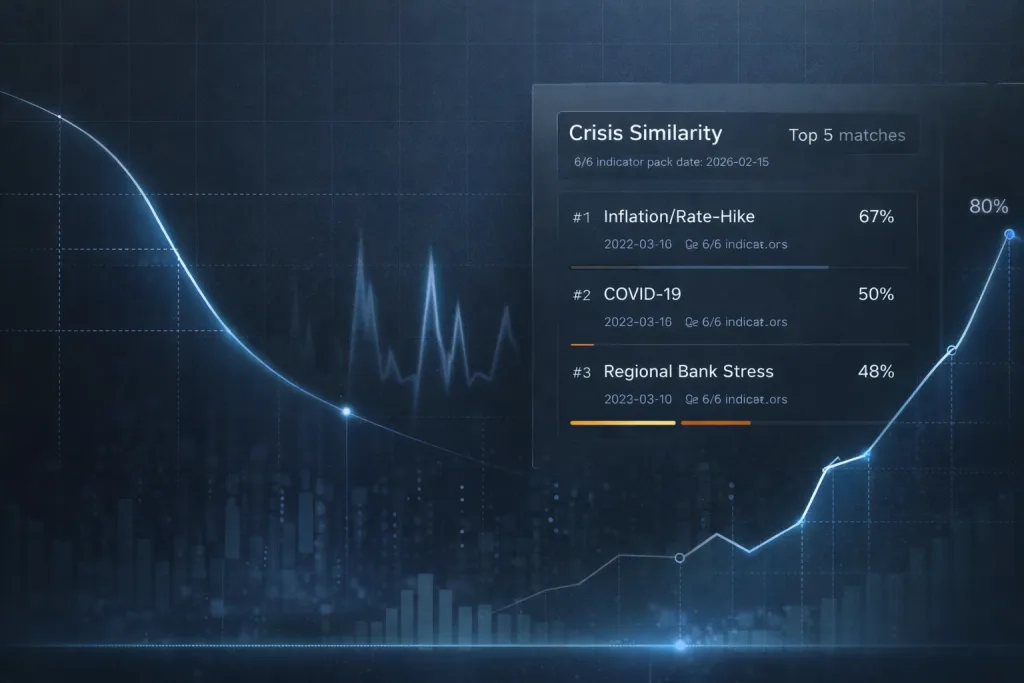
A more systematic attempt to quantify such analogies comes from tools like the Crisis Similarity indicator published on MacroRisk Sentinel (see the dashboard and methodology description here: https://macrorisksentinel.com). Rather than relying on narrative comparisons, the framework aggregates multiple U.S. macro-risk indicators — including yield curve dynamics, valuation regimes, volatility behaviour, labour market signals, sovereign leverage and recession probability — and compares the current configuration to past crisis regimes.
According to the most recent reading visible on the dashboard, the current macro setup shows the strongest similarity to an Inflation / Rate-Hike regime (67%), followed by COVID-era shock conditions (50%) and Regional Bank Stress (48%). By contrast, similarity to the Global Financial Crisis is significantly lower at 25%, while resemblance to the Dot-com / 2001 recession environment is negligible.
For serious investors, the key question is not whether the indicator is “right” in a predictive sense. The relevant question is what kind of macro regime interpretation this configuration supports.
A market still dominated by restrictive policy conditions
The dominant similarity signal — an inflation-driven tightening cycle — aligns with the macro reality since the Federal Reserve began raising rates in March 2022 in response to persistent inflation pressures. Restrictive policy regimes historically reshape asset pricing through higher discount rates, tighter liquidity conditions and delayed transmission effects into credit and growth.
In practical terms, such environments tend to reward balance-sheet strength, pricing power and earnings durability, while exposing assets whose valuations depend heavily on distant cash flows or continued cheap financing.
A high similarity score to this regime should therefore be interpreted less as a crisis alarm and more as confirmation that markets remain structurally influenced by monetary constraint rather than liquidity expansion.
Why residual “shock fragility” still appears in the signal mix
The relatively strong similarity to COVID-era conditions may initially seem counterintuitive. Today’s environment lacks the abrupt exogenous disruption that defined early 2020.
However, when viewed through a multi-indicator lens — as described on the MacroRisk Sentinel methodology page — the comparison reflects not the specific cause of the crisis but the pattern of systemic sensitivity. During shock regimes, correlations rise, risk repricing accelerates and investor confidence can shift quickly.
Current readings suggest that markets still display traces of this latent fragility, particularly in how macro data surprises or policy expectations propagate through volatility and credit conditions.
This does not imply an imminent pandemic-style drawdown. It indicates that the system remains more reactive than in stable expansion phases.
Selective financial stress remains a credible transmission channel
The similarity to regional banking stress is also notable. Events such as the collapse of Silicon Valley Bank in March 2023 illustrated how rapid increases in rates can expose duration mismatches and funding vulnerabilities within parts of the financial system.
A near-50% similarity reading should therefore be read as a signal that tightening cycles often produce localized breakage before broad macro deterioration becomes visible. Markets frequently underestimate this transmission dynamic because headline indices may remain resilient until second-order effects accumulate.
For investors, this reinforces the importance of analysing financial plumbing risks — not just aggregate growth forecasts.
Why this is not primarily a replay of 2008
Perhaps the most important takeaway is what the indicator does not show.
Similarity to the Global Financial Crisis remains materially lower than to tightening or shock regimes. Historically, the 2007-2009 period involved systemic balance-sheet impairment, cascading credit losses and synchronized global contraction.
A lower similarity reading suggests that, at least based on current macro-risk configurations, markets are not being interpreted as facing an equivalent system-wide insolvency dynamic. That distinction matters for asset allocation because it differentiates between environments where liquidity risk dominates and those where valuation and growth repricing play a larger role.
And clearly not a classic valuation bubble unwind
The near-zero resemblance to the 2001 downturn also carries informational value. The dot-com bust was primarily driven by equity valuation excesses and subsequent earnings disappointments rather than policy tightening or banking stress transmission.
The current configuration implies that today’s risk landscape is less about speculative bubble collapse and more about macro policy after-effects and financial stability sensitivities.
This nuance should temper simplistic narratives that attempt to frame every cycle as a repetition of familiar equity-market archetypes.
Regime awareness matters more than crisis forecasting
Tools such as the Crisis Similarity indicator are best understood as contextual regime classifiers rather than forecasting devices. Their value lies in highlighting structural similarities that may influence how shocks propagate, how liquidity behaves and how risk premiums adjust.
At present, the signal mix suggests a market environment characterized by:
- persistent influence of restrictive monetary policy
- residual systemic sensitivity to macro surprises
- credible probability of localized financial stress episodes
- limited resemblance to full-scale systemic crisis or pure valuation unwind
For long-term investors, this interpretation supports a disciplined focus on portfolio resilience rather than binary risk-on or risk-off positioning.
In other words, the most useful lesson from current Crisis Similarity readings is not that a specific historical crisis is about to repeat. It is that markets remain anchored in a regime where policy constraint and selective fragility coexist — a combination that demands selectivity, patience and realistic return expectations.
![]()
![]()
![]()
![]()
![]()
![]()
![]()
![]()
![]()
![]()
![]()
![]()

