Bitcoin’s long-term chart still shows a familiar pattern: violent bull markets, deep corrections, and a new all-time high every cycle. But one part of that pattern has changed in plain sight. Price peaks have kept rising, while MVRV peaks have kept falling. That divergence matters because it suggests Bitcoin is not losing its cyclical nature, but it is losing some of the excess that defined earlier tops. Glassnode defines MVRV as market cap divided by realized cap, and uses it as a way to measure how far price has moved away from the aggregate on-chain cost basis. Historically, very high readings have been associated with overheated market conditions and cycle-top risk.
The price history makes the point immediately. Fidelity’s current cycle review summarizes the classic sequence clearly: Bitcoin formed major tops around $1,150 in November 2013, $19,800 in December 2017, and $69,000 in November 2021. In the same framework, Fidelity notes that if the historical four-year pattern continued cleanly, the next cyclical top would have been October 6, 2025, at just above $126,200. NYDIG independently dates that cyclical top to October 6, 2025, at $126,296.
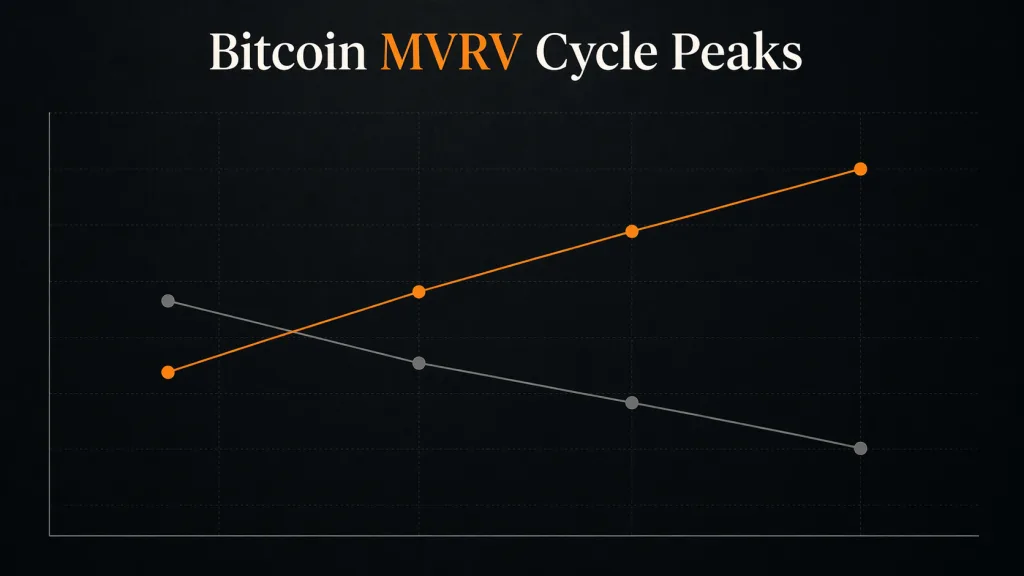
Now compare those rising prices with the MVRV structure. NYDIG explicitly notes that the amplitude of MVRV peaks has declined over time and may continue to do so. That is the core of the thesis. Earlier Bitcoin tops needed extreme speculative excess. Later tops needed less. The market is larger, more liquid, and more capable of absorbing distribution before the final price high. That does not make Bitcoin “safe.” It makes it more structurally mature than it was in 2013 or 2017.
Rising Price Peaks, Falling MVRV Peaks
This is also why the market can post a higher price high while looking less euphoric on-chain. In previous cycles, investors often expected the final top to arrive with obvious blow-off conditions. That assumption is weaker now. NYDIG’s work on cycle structure makes that clear: current and recent cycle behavior has shown declining trough-to-peak amplitude, lower drawdown severity than in prior cycles, and a broader tendency toward less violent market structure as Bitcoin matures. Their May 2025 research noted that the path from the November 2022 trough near $15,460 to above $112,000 still included substantial pullbacks, but that this cycle had already been materially less volatile than the previous two.
That is where MVRV becomes more useful as a structural filter than as a magic sell signal. The important message is not that one exact number will mark the next top. The message is that each new cycle may need less MVRV expansion to produce a major price peak. If that trend continues, then waiting for a dramatic 2013-style on-chain blowoff may be a mistake. The next top may arrive with a much cooler surface appearance than many investors expect. NYDIG’s conclusion that MVRV peak amplitude has been trending down is one of the clearest institutional-quality arguments for that view.
A practical way to translate that into market thinking is to stop treating price and MVRV as if they must peak together. Even when Bitcoin prints a fresh nominal high, the underlying on-chain signal can be less extreme because realized cap keeps rising as profits are taken and coins are repriced on-chain. In other words, higher price does not require higher euphoria. That is exactly the kind of shift one would expect from a market with more institutional participation, deeper liquidity, broader ownership, and a slower transmission from momentum into frenzy. Fidelity Digital Assets has made a similar argument from a different angle, suggesting Bitcoin may be moving away from the older pattern of textbook boom-bust extremes.
A Simple Working Scenario for the Next Cycle
That brings us to the forward scenario. Based on the historical four-year spacing described by Fidelity, the next major cycle high after the 2025 top would point toward 2029, not because the calendar is precise, but because the broader rhythm has been consistent enough to use as a working framework. Fidelity also warns that the four-year pattern is not precise and that the historical sample is limited, which is the right caution to keep in mind. Still, if one combines that cycle timing with the trend of falling MVRV peak amplitudes, a clean working scenario emerges: a serious late-cycle fakeout in late 2028 or early 2029, followed by a final major price top in Q4 2029. The price zones suggested by that framework are not certainties, but a disciplined base case would be roughly $145,000–$160,000 for a fakeout phase and $190,000–$210,000 for a final-cycle high. That range is an inference from the historical timing and amplitude pattern, not a published target from the cited sources.
That kind of scenario becomes more useful when it is read against macro conditions rather than in isolation. This is also where MacroRiskSentinel.com is relevant. The site publicly presents a U.S. macro dashboard built around core indicators such as the yield curve, CAPE, VIX, unemployment, debt-to-GDP, and recession probability, while also surfacing additional signals including the Buffett Indicator, Corporate Bond Spread (BAA–10Y), and Industrial Production (INDPRO). For Bitcoin investors, that matters because a late-cycle crypto setup can look very different in a benign liquidity environment than it does in a tightening or recessionary one. On-chain signals tell you something important. Macro context tells you whether the market is likely to absorb that signal calmly or violently.
Conclusion
The clean takeaway is not complicated.
Bitcoin has kept making higher price highs.
Its cycle MVRV peaks appear to be making lower highs.
That is not a contradiction. It is the point.
Bitcoin still behaves like a cyclical asset, but the character of those cycles is changing. The market appears to need less visible excess to reach a major top than it did in earlier years. For investors, that means the next important top may not come with the same obvious insanity that marked prior peaks. If the historical pattern continues, then the real edge will not come from predicting the exact candle. It will come from recognizing that the next major top may arrive with less drama, lower MVRV, and a more mature price structure than the market is used to.
References
- Glassnode, MVRV Ratio.
- Glassnode Studio, Mastering the MVRV Ratio Dashboard.
- Fidelity, Bitcoin’s 4-year cycles explained.
- NYDIG, Where Could Bitcoin Go This Cycle.
- NYDIG, We’re at an All-Time High.
- NYDIG, Bitcoin’s Cycle Reasserts Itself: Where We Are and What Comes Next.
- Fidelity Digital Assets, Is Bitcoin’s Four-Year Cycle Over?
- MacroRisk Sentinel homepage and public indicator pages.
![]()
![]()
![]()
![]()
![]()
![]()
![]()
![]()
![]()
![]()
![]()
![]()

